Momentum Dashboard
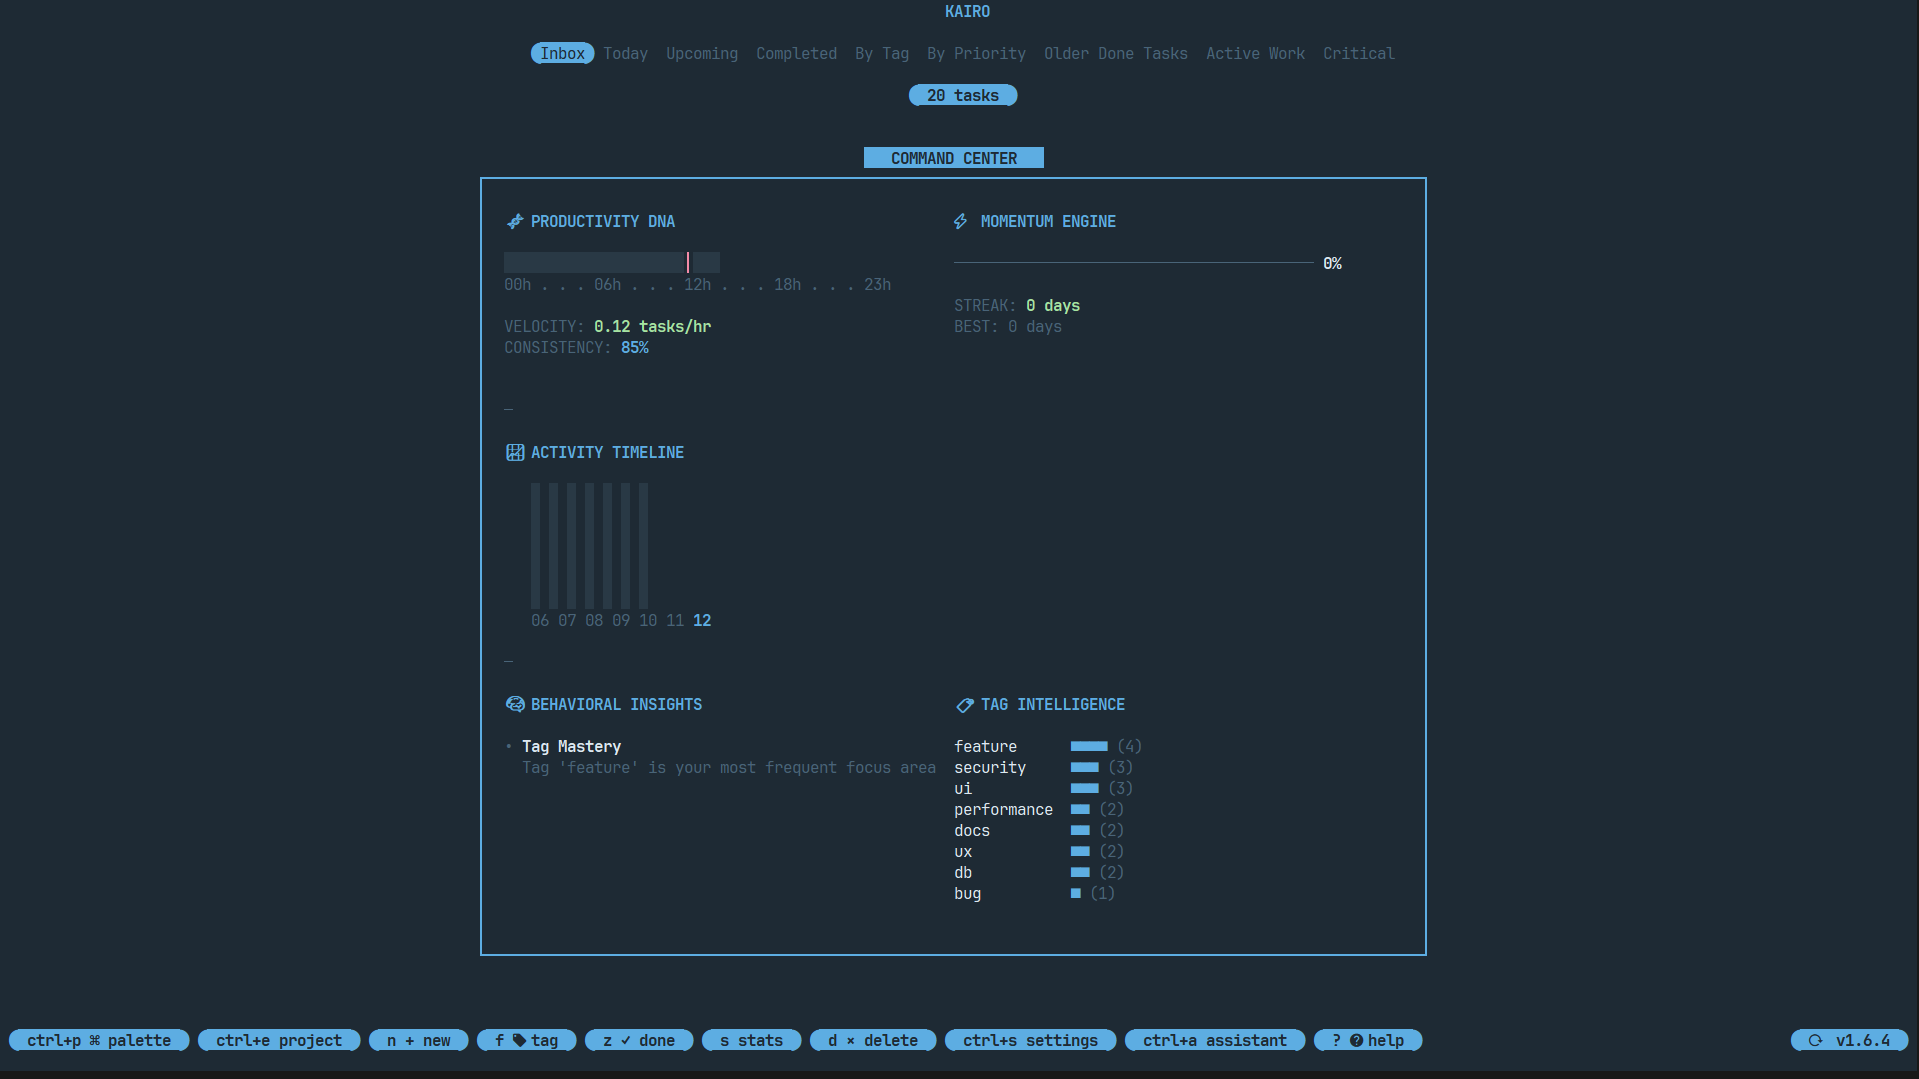
The Momentum Dashboard is Kairo's command center. It transforms static data into actionable insights, helping you visualize your productivity.
Accessing the Dashboard
Press s from the main task list to toggle the dashboard.
Key Modules
Productivity DNA
A visual representation of your task completion patterns. It shows:
- Daily Completion: Number of tasks completed today.
- Weekly Trend: A mini-graph of your activity over the last 7 days.
- Top Tags: The categories you're most active in.
Momentum Meter
A real-time gauge of your current "flow". Completing tasks, starting focus sessions, and staying active increases your momentum.
Project Breakdown
If you're in a specific project, the dashboard shows:
- Completion Percentage: Progress towards finishing the project.
- Upcoming Deadlines: The next 3 critical tasks in this project.
- Time Spent: Total time logged in focus sessions for this project.
Behavioral Insights
Kairo analyzes your data to provide smart tips, such as:
- "You're most productive between 10 AM and 12 PM."
- "You have 5 high-priority tasks overdue - focus on those first."
Bentham-Style Layout
The dashboard uses a clean, module-based layout (inspired by Bento grids) that stays readable even in smaller terminal windows.